
MODE OF DATA
The mode of the data is the data value that has the highest frequency. In other words, a data value that has occurred for the most number of times in the dataset is the mode of that dataset.
A mode is supposed to represent the data, as it is supposed that the value which has occurred the most number of times, can be considered as the characteristic of that data. The mode doesn’t take into account every value of the dataset, but only the one which occurs the highest number of times.
MEDIAN OF THE DATA
The median of the data represents the central value of the sorted data. For calculating the median, the data is sorted and then the value at the central index is considered as the median. Median doesn’t take into account all the data values, but only the one at the central index.
Suppose ’n’ is the number of data points. The formula for the median is,
Case1: WHEN ’n’ IS ODD
Median = value at index (n+1)/2
Case2: WHEN ’n’ IS EVEN
Median = ((value at index n/2) + (value at index (n+1)/2))/2
MEAN OF THE DATA
The mean of the data is the average value of all the data points. It takes into account all the data points and hence, is most reliable.
Mean = sum of terms / number of terms
SKEWNESS
Skewness is a measure of the spread of data. Skewness represents the asymmetry of data. The exactly symmetric curve has skewness = 0.
Skewness = 0: When the value from the skew() function comes out to be 0, that is when the curve is said to be normally distributed, and the distribution is called Z distribution or Normal distribution. In this case,
Mode = Median = Mean
The Z- distribution, also called the normal distribution is a bell-shaped curve that is symmetrical on both sides of the mean. In the case of Z- distribution or Normal distribution, the number of data points on both the sides of the mean is the same and that is the reason for this curve is symmetrical.
Below is given some data of ages of 37 people. Try visualizing what this data looks like.
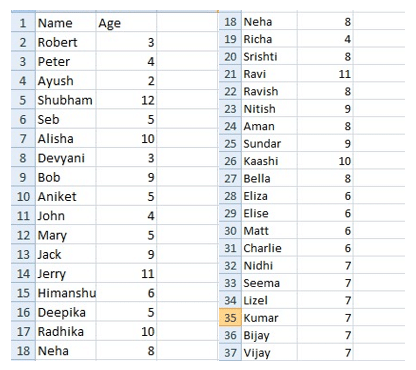
Let’s calculate the mean, median, and mode of this given data. Using numpy, pandas, and matplotlib for the complete process. Read the data set from the local drive. Calculating the mean, mode and median with Python, mean = median = mode.