
Facebook released its first map that tracks coronavirus symptoms in every county across the United States. The tech giant also plans to update it daily throughout the outbreak.
All data used for the map comes from the opt-in survey created by Facebook in partnership with Carnegie Mellon University. The survey is designed to help identify Covid-19 hotspots before the cases are confirmed.
Facebook is uniquely suited to run these surveys because we serve a global community of billions of people and can do statistically accurate sampling. We do this in a privacy protective way where only the researchers at Carnegie Mellon see individual survey responses — and Facebook only sees aggregated data, Zuckerberg said in a Facebook post.
The map shows the percentage of people per county who have self-reported loss of smell, cough, fever and other known coronavirus symptoms.
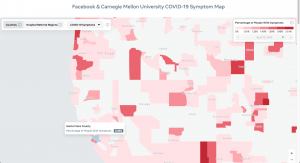
For example, it shows that 0.36% of people in Santa Clara County (in the heart of Silicon Valley) have reported coronavirus symptoms. But, in fact, a large portion of the map does not have enough participants to show data.
The next step for Facebook is to start running these surveys globally.
“This will allow us to expand the symptom maps to provide county-by-county data across almost every country in the world where Facebook operates”, Zuckerberg explained.
Facebook is also looking for more research partners around the world to help aggregate data and more details on how such partners to get involved are expected soon.